How the numbers are calculated
No single public source publishes this ratio, so we built it from two that do. For each state and each year, we took three medians from the U.S. Census Bureau's American Community Survey (1-year estimates): the median value of owner-occupied homes, the median real estate taxes paid, and the median household income. We then ran the median home through the same mortgage formula our mortgage payment calculator uses:
- 20% down payment, 30-year fixed loan
- Interest rate: the calendar-year average of Freddie Mac's weekly 30-year fixed rate (2025: 6.60%)
- Monthly cost = principal and interest + one-twelfth of the median property tax bill
- Cost share = monthly cost × 12 ÷ median household income
Two limits are worth knowing. First, this is a ratio of two medians, not the typical household's own ratio; the household earning the median income is not necessarily the one buying the median home. Second, homeowners insurance, HOA dues and mortgage insurance are not included because there is no consistent public series for them by state. The real cost of owning is higher than the figures here.
The Census Bureau did not release standard 1-year ACS estimates for 2020, so that year is missing from the trend rather than estimated.
Least and most affordable states in 2025
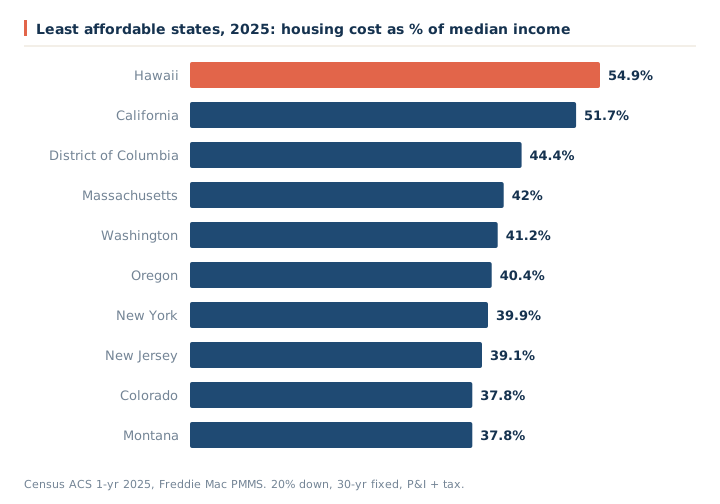
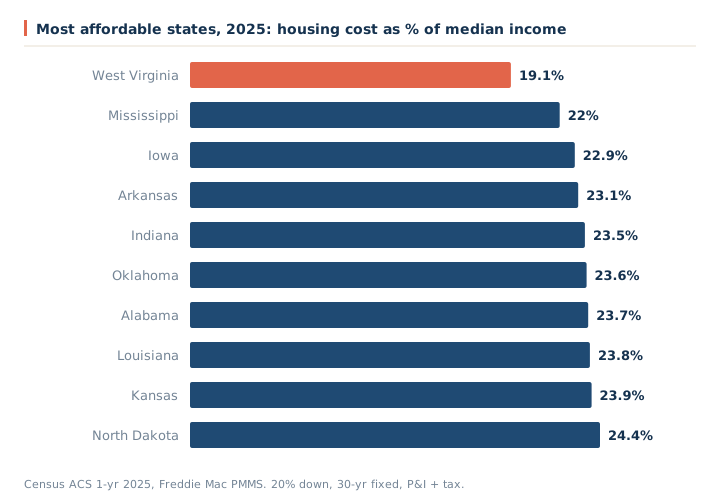
In the least affordable states, home values have run far ahead of incomes. In Hawaii the median home was worth 8.6 times the median household income; in West Virginia it was 2.9 times. Property tax does not drive the ranking. Hawaii's effective tax rate of 0.26% ranks the lowest of the 51, yet the state is still the least affordable.
How affordability changed nationally, 2010 to 2025
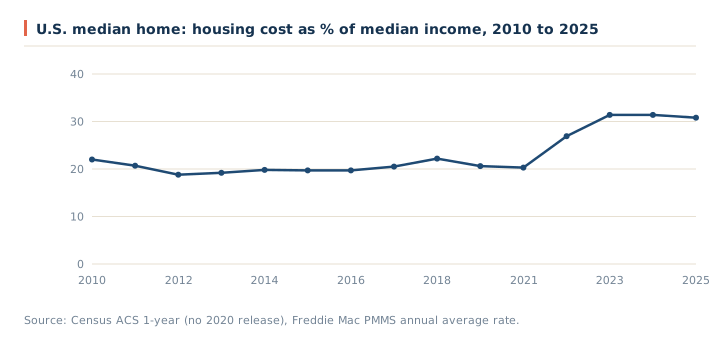
From 2010 to 2021, falling rates offset rising prices, and the share stayed in a narrow band. Its low point was 18.8% in 2012. After 2021 both forces pushed the same way: the average rate more than doubled, and the median home value kept climbing. The share peaked at 31.4% in 2023.
| Year | Avg. 30-yr rate | Median home value | Median household income | Monthly P&I + tax | Cost share |
|---|---|---|---|---|---|
| 2010 | 4.69% | $179,900 | $50,046 | $916 | 22.0% |
| 2011 | 4.45% | $173,600 | $50,502 | $871 | 20.7% |
| 2012 | 3.66% | $171,900 | $51,371 | $803 | 18.8% |
| 2013 | 3.98% | $173,900 | $52,250 | $837 | 19.2% |
| 2014 | 4.17% | $181,200 | $53,657 | $885 | 19.8% |
| 2015 | 3.85% | $194,500 | $55,775 | $918 | 19.7% |
| 2016 | 3.65% | $205,000 | $57,617 | $945 | 19.7% |
| 2017 | 3.99% | $217,600 | $60,336 | $1,032 | 20.5% |
| 2018 | 4.54% | $229,700 | $61,937 | $1,145 | 22.2% |
| 2019 | 3.94% | $240,500 | $65,712 | $1,127 | 20.6% |
| 2021 | 2.96% | $281,400 | $69,717 | $1,177 | 20.3% |
| 2022 | 5.34% | $320,900 | $74,755 | $1,674 | 26.9% |
| 2023 | 6.81% | $340,200 | $77,719 | $2,031 | 31.4% |
| 2024 | 6.72% | $360,600 | $81,604 | $2,133 | 31.4% |
| 2025 | 6.60% | $371,100 | $84,780 | $2,175 | 30.8% |
Where affordability worsened most since 2019
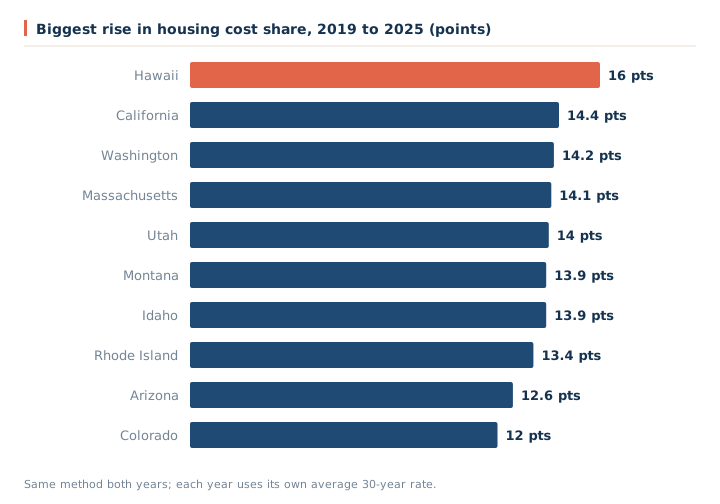
2019 is the last year before the pandemic housing boom. Comparing it with 2025, the share rose in 51 states. The ten states with the biggest increases averaged 27.0% in 2019, against 20.6% for the U.S. median home: most of the damage landed where homes were already expensive.
Property tax by state
The effective property tax rate below is the median tax bill divided by the median home value, both from the same Census survey. It is a statewide figure; county and city rates can differ a lot, so use our property tax calculator with your local rate for a specific home.
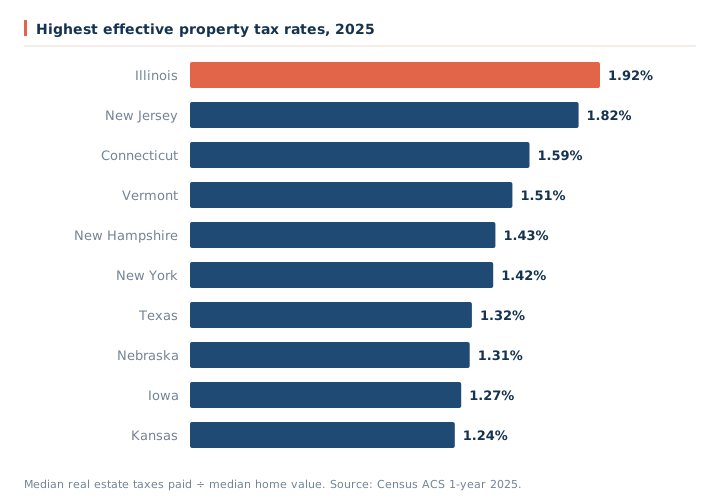
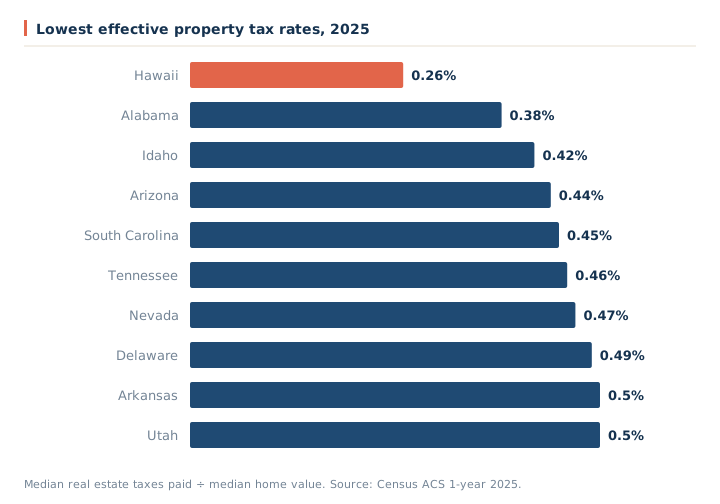
A high rate does not always mean a proportionally high bill. Illinois's rate is 7.4 times Hawaii's, but its median bill ($5,655 vs. $2,387) is 2.4 times as large, because home values differ too.
All 50 states and DC, 2025
Sorted from least to most affordable. "At 7.24%" re-prices the same 2025 home and income at the latest weekly rate.
| State | Median home value | Median property tax | Effective tax rate | Median household income | Monthly P&I + tax | Cost share (6.60%) | At 7.24% |
|---|---|---|---|---|---|---|---|
| Hawaii | $901,500 | $2,387 | 0.26% | $105,013 | $4,805 | 54.9% | 58.4% |
| California | $770,700 | $5,537 | 0.72% | $102,159 | $4,399 | 51.7% | 54.8% |
| District of Columbia | $715,500 | $4,805 | 0.67% | $109,505 | $4,056 | 44.4% | 47.1% |
| Massachusetts | $626,900 | $6,345 | 1.01% | $106,539 | $3,732 | 42.0% | 44.5% |
| Washington | $605,600 | $4,911 | 0.81% | $101,946 | $3,503 | 41.2% | 43.7% |
| Oregon | $507,900 | $4,009 | 0.79% | $86,953 | $2,929 | 40.4% | 42.8% |
| New York | $470,900 | $6,706 | 1.42% | $89,210 | $2,965 | 39.9% | 42.1% |
| New Jersey | $530,800 | $9,648 | 1.82% | $107,797 | $3,516 | 39.1% | 41.2% |
| Colorado | $567,600 | $2,945 | 0.52% | $99,729 | $3,145 | 37.8% | 40.2% |
| Montana | $427,500 | $2,947 | 0.69% | $77,099 | $2,430 | 37.8% | 40.1% |
| Rhode Island | $478,700 | $4,901 | 1.02% | $91,039 | $2,854 | 37.6% | 39.8% |
| Utah | $543,400 | $2,738 | 0.50% | $99,311 | $3,005 | 36.3% | 38.6% |
| Idaho | $457,800 | $1,924 | 0.42% | $84,234 | $2,499 | 35.6% | 37.8% |
| Nevada | $459,400 | $2,172 | 0.47% | $85,198 | $2,528 | 35.6% | 37.8% |
| New Hampshire | $487,100 | $6,983 | 1.43% | $106,759 | $3,071 | 34.5% | 36.4% |
| Florida | $396,700 | $3,180 | 0.80% | $80,846 | $2,292 | 34.0% | 36.0% |
| Arizona | $427,600 | $1,894 | 0.44% | $82,940 | $2,343 | 33.9% | 36.0% |
| Connecticut | $423,900 | $6,725 | 1.59% | $100,056 | $2,726 | 32.7% | 34.4% |
| Maine | $370,300 | $3,404 | 0.92% | $81,760 | $2,176 | 31.9% | 33.8% |
| Vermont | $359,800 | $5,418 | 1.51% | $86,018 | $2,290 | 31.9% | 33.7% |
| North Carolina | $342,800 | $2,177 | 0.64% | $77,638 | $1,933 | 29.9% | 31.7% |
| Tennessee | $341,200 | $1,558 | 0.46% | $75,875 | $1,873 | 29.6% | 31.5% |
| Wyoming | $357,300 | $1,987 | 0.56% | $80,894 | $1,991 | 29.5% | 31.4% |
| Maryland | $445,800 | $4,368 | 0.98% | $107,700 | $2,642 | 29.4% | 31.1% |
| Georgia | $346,500 | $2,680 | 0.77% | $81,847 | $1,994 | 29.2% | 31.0% |
| Alaska | $385,100 | $4,067 | 1.06% | $95,220 | $2,307 | 29.1% | 30.7% |
| Virginia | $422,600 | $3,003 | 0.71% | $99,322 | $2,409 | 29.1% | 30.9% |
| Wisconsin | $316,500 | $3,810 | 1.20% | $80,213 | $1,935 | 28.9% | 30.6% |
| Texas | $318,100 | $4,205 | 1.32% | $82,625 | $1,976 | 28.7% | 30.3% |
| New Mexico | $293,400 | $1,856 | 0.63% | $70,342 | $1,654 | 28.2% | 29.9% |
| Delaware | $392,600 | $1,911 | 0.49% | $92,520 | $2,165 | 28.1% | 29.8% |
| Minnesota | $353,800 | $3,682 | 1.04% | $92,297 | $2,114 | 27.5% | 29.1% |
| Illinois | $294,400 | $5,655 | 1.92% | $86,676 | $1,975 | 27.3% | 28.7% |
| South Carolina | $306,200 | $1,367 | 0.45% | $73,672 | $1,678 | 27.3% | 29.0% |
| South Dakota | $299,100 | $3,098 | 1.04% | $80,506 | $1,786 | 26.6% | 28.2% |
| Michigan | $269,500 | $3,163 | 1.17% | $75,832 | $1,641 | 26.0% | 27.4% |
| Pennsylvania | $292,400 | $3,288 | 1.12% | $81,473 | $1,768 | 26.0% | 27.5% |
| Nebraska | $279,200 | $3,665 | 1.31% | $81,614 | $1,732 | 25.5% | 26.9% |
| Ohio | $254,100 | $3,107 | 1.22% | $74,804 | $1,557 | 25.0% | 26.4% |
| Kentucky | $242,000 | $1,734 | 0.72% | $66,447 | $1,381 | 24.9% | 26.4% |
| Missouri | $271,400 | $2,145 | 0.79% | $75,485 | $1,565 | 24.9% | 26.4% |
| North Dakota | $281,700 | $2,600 | 0.92% | $81,545 | $1,656 | 24.4% | 25.8% |
| Kansas | $252,600 | $3,144 | 1.24% | $77,824 | $1,553 | 23.9% | 25.3% |
| Louisiana | $231,800 | $1,268 | 0.55% | $65,139 | $1,290 | 23.8% | 25.2% |
| Alabama | $246,500 | $946 | 0.38% | $67,663 | $1,338 | 23.7% | 25.2% |
| Oklahoma | $234,000 | $1,781 | 0.76% | $68,441 | $1,344 | 23.6% | 25.0% |
| Indiana | $255,200 | $1,884 | 0.74% | $74,516 | $1,461 | 23.5% | 24.9% |
| Arkansas | $228,400 | $1,142 | 0.50% | $65,588 | $1,262 | 23.1% | 24.5% |
| Iowa | $237,000 | $3,014 | 1.27% | $76,483 | $1,462 | 22.9% | 24.2% |
| Mississippi | $192,700 | $1,248 | 0.65% | $59,346 | $1,089 | 22.0% | 23.3% |
| West Virginia | $176,300 | $904 | 0.51% | $61,340 | $976 | 19.1% | 20.3% |
Sources: U.S. Census Bureau, American Community Survey 1-year estimates, tables B25077, B25103 and B19013; Freddie Mac Primary Mortgage Market Survey. Calculations by SmartMortgageCalcs. Retrieved November 4, 2026.
Using these figures for your own purchase
A statewide median hides a wide range. Use the table to see where your state stands, then put your own price, rate and taxes into the mortgage affordability calculator. A common lender guideline keeps housing costs near 28% of gross income. In 2025, the U.S. median home sat above that line at 30.8%, before insurance.